<pre id="vvttv"><mark id="vvttv"><progress id="vvttv"></progress></mark></pre>
    <pre id="vvttv"></pre>

      <p id="vvttv"></p>

          <p id="vvttv"></p>

                <p id="vvttv"></p>

                <pre id="vvttv"><cite id="vvttv"><progress id="vvttv"></progress></cite></pre>

                  <output id="vvttv"><dfn id="vvttv"><th id="vvttv"></th></dfn></output>

                    <p id="vvttv"></p>

                    繪制Mandelbrot集合?

                    相關文檔: Mandelbrot集合
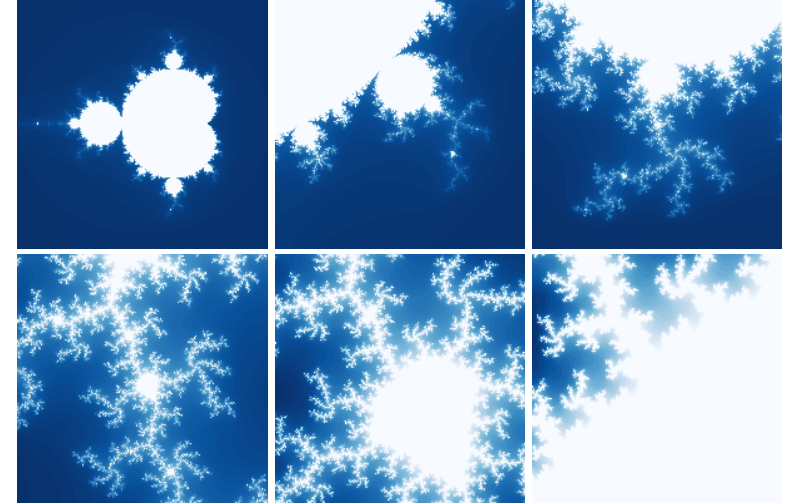
                    _images/fractal_mandelbrot01.png

                    純Python計算版本?

                    # -*- coding: utf-8 -*-
                    
                    import numpy as np
                    import pylab as pl
                    import time
                    from matplotlib import cm
                    
                    def iter_point(c):
                        z = c
                        for i in xrange(1, 100): # 最多迭代100次
                            if abs(z)>2: break # 半徑大于2則認為逃逸
                            z = z*z+c
                        return i # 返回迭代次數
                        
                    def draw_mandelbrot(cx, cy, d):
                        """
                        繪制點(cx, cy)附近正負d的范圍的Mandelbrot
                        """
                        x0, x1, y0, y1 = cx-d, cx+d, cy-d, cy+d 
                        y, x = np.ogrid[y0:y1:200j, x0:x1:200j]
                        c = x + y*1j
                        start = time.clock()
                        mandelbrot = np.frompyfunc(iter_point,1,1)(c).astype(np.float)
                        print "time=",time.clock() - start
                        pl.imshow(mandelbrot, cmap=cm.Blues_r, extent=[x0,x1,y0,y1])
                        pl.gca().set_axis_off()
                        
                    x,y = 0.27322626, 0.595153338
                    
                    pl.subplot(231)
                    draw_mandelbrot(-0.5,0,1.5)
                    for i in range(2,7):    
                        pl.subplot(230+i)
                        draw_mandelbrot(x, y, 0.2**(i-1))
                    pl.subplots_adjust(0.02, 0, 0.98, 1, 0.02, 0)
                    pl.show()
                    

                    Weave版本?

                    # -*- coding: utf-8 -*-
                    
                    import numpy as np
                    import pylab as pl
                    import time
                    import scipy.weave as weave
                    from matplotlib import cm
                        
                    def weave_iter_point(c):
                        code = """
                        std::complex<double> z;
                        int i;
                        z = c;
                        for(i=1;i<100;i++) 
                        {
                            if(std::abs(z) > 2) break;
                            z = z*z+c;
                        }
                        return_val=i;
                        """
                        
                        f = weave.inline(code, ["c"], compiler="gcc")
                        return f
                    
                    def draw_mandelbrot(cx, cy, d,N=200):
                        """
                        繪制點(cx, cy)附近正負d的范圍的Mandelbrot
                        """
                        x0, x1, y0, y1 = cx-d, cx+d, cy-d, cy+d 
                        y, x = np.ogrid[y0:y1:N*1j, x0:x1:N*1j]
                        c = x + y*1j
                        start = time.clock()
                        mandelbrot = np.frompyfunc(weave_iter_point,1,1)(c).astype(np.float)
                        print "time=",time.clock() - start
                        pl.imshow(mandelbrot, cmap=cm.Blues_r, extent=[x0,x1,y0,y1])
                        pl.gca().set_axis_off()
                        
                    x,y = 0.27322626, 0.595153338
                    
                    pl.subplot(231)
                    draw_mandelbrot(-0.5,0,1.5)
                    for i in range(2,7):    
                        pl.subplot(230+i)
                        draw_mandelbrot(x, y, 0.2**(i-1))
                    pl.subplots_adjust(0.02, 0, 0.98, 1, 0.02, 0.02)
                    
                    pl.show()
                    

                    NumPy加速版本?

                    # -*- coding: utf-8 -*-
                    
                    import numpy as np
                    import pylab as pl
                    import time
                    from matplotlib import cm
                    
                    def draw_mandelbrot(cx, cy, d, N=200):
                        """
                        繪制點(cx, cy)附近正負d的范圍的Mandelbrot
                        """
                        global mandelbrot
                    
                        x0, x1, y0, y1 = cx-d, cx+d, cy-d, cy+d 
                        y, x = np.ogrid[y0:y1:N*1j, x0:x1:N*1j]
                        c = x + y*1j
                    
                        # 創建X,Y軸的坐標數組
                        ix, iy = np.mgrid[0:N,0:N]
                        
                        # 創建保存mandelbrot圖的二維數組,缺省值為最大迭代次數
                        mandelbrot = np.ones(c.shape, dtype=np.int)*100
                        
                        # 將數組都變成一維的
                        ix.shape = -1
                        iy.shape = -1
                        c.shape = -1
                        z = c.copy() # 從c開始迭代,因此開始的迭代次數為1
                        
                        start = time.clock()
                        
                        for i in xrange(1,100):
                            # 進行一次迭代
                            z *= z
                            z += c
                            # 找到所有結果逃逸了的點
                            tmp = np.abs(z) > 2.0
                            # 將這些逃逸點的迭代次數賦值給mandelbrot圖
                            mandelbrot[ix[tmp], iy[tmp]] = i
                            
                            # 找到所有沒有逃逸的點
                            np.logical_not(tmp, tmp)
                            # 更新ix, iy, c, z只包含沒有逃逸的點
                            ix,iy,c,z = ix[tmp], iy[tmp], c[tmp],z[tmp]
                            if len(z) == 0: break
                    
                        print "time=",time.clock() - start
                        pl.imshow(mandelbrot, cmap=cm.Blues_r, extent=[x0,x1,y0,y1])
                        pl.gca().set_axis_off()
                        
                    x,y = 0.27322626, 0.595153338
                    
                    pl.subplot(231)
                    draw_mandelbrot(-0.5,0,1.5)
                    for i in range(2,7):    
                        pl.subplot(230+i)
                        draw_mandelbrot(x, y, 0.2**(i-1))
                    pl.subplots_adjust(0.02, 0, 0.98, 1, 0.02, 0)
                    pl.show()
                    

                    平滑版本?

                    _images/fractal_mandelbrot02.png
                    # -*- coding: utf-8 -*-
                    
                    import numpy as np
                    import pylab as pl
                    from math import log
                    from matplotlib import cm
                    
                    escape_radius = 10
                    iter_num = 20
                    
                    def smooth_iter_point(c):
                        z = c
                        for i in xrange(1, iter_num): 
                            if abs(z)>escape_radius: break 
                            z = z*z+c
                        absz = abs(z)
                        if absz > 2.0:
                            mu = i - log(log(abs(z),2),2)
                        else:
                            mu = i
                        return mu # 返回正規化的迭代次數
                        
                    def iter_point(c):
                        z = c
                        for i in xrange(1, iter_num):
                            if abs(z)>escape_radius: break 
                            z = z*z+c
                        return i
                        
                    def draw_mandelbrot(cx, cy, d, N=200):
                        global mandelbrot
                        """
                        繪制點(cx, cy)附近正負d的范圍的Mandelbrot
                        """
                        x0, x1, y0, y1 = cx-d, cx+d, cy-d, cy+d 
                        y, x = np.ogrid[y0:y1:N*1j, x0:x1:N*1j]
                        c = x + y*1j
                        mand = np.frompyfunc(iter_point,1,1)(c).astype(np.float)
                        smooth_mand = np.frompyfunc(smooth_iter_point,1,1)(c).astype(np.float)
                        pl.subplot(121)
                        pl.gca().set_axis_off()
                        pl.imshow(mand, cmap=cm.Blues_r, extent=[x0,x1,y0,y1])
                        pl.subplot(122)    
                        pl.imshow(smooth_mand, cmap=cm.Blues_r, extent=[x0,x1,y0,y1])
                        pl.gca().set_axis_off()
                        
                    draw_mandelbrot(-0.5,0,1.5,300)
                    pl.subplots_adjust(0.02, 0, 0.98, 1, 0.02, 0)
                    pl.show()
                    

                    首頁目錄

                    上一篇文章

                    雙擺系統的動畫模擬

                    下一篇文章

                    迭代函數系統的分形

                      <pre id="vvttv"><mark id="vvttv"><progress id="vvttv"></progress></mark></pre>
                      <pre id="vvttv"></pre>

                        <p id="vvttv"></p>

                            <p id="vvttv"></p>

                                  <p id="vvttv"></p>

                                  <pre id="vvttv"><cite id="vvttv"><progress id="vvttv"></progress></cite></pre>

                                    <output id="vvttv"><dfn id="vvttv"><th id="vvttv"></th></dfn></output>

                                      <p id="vvttv"></p>

                                      这里只有精品视频